
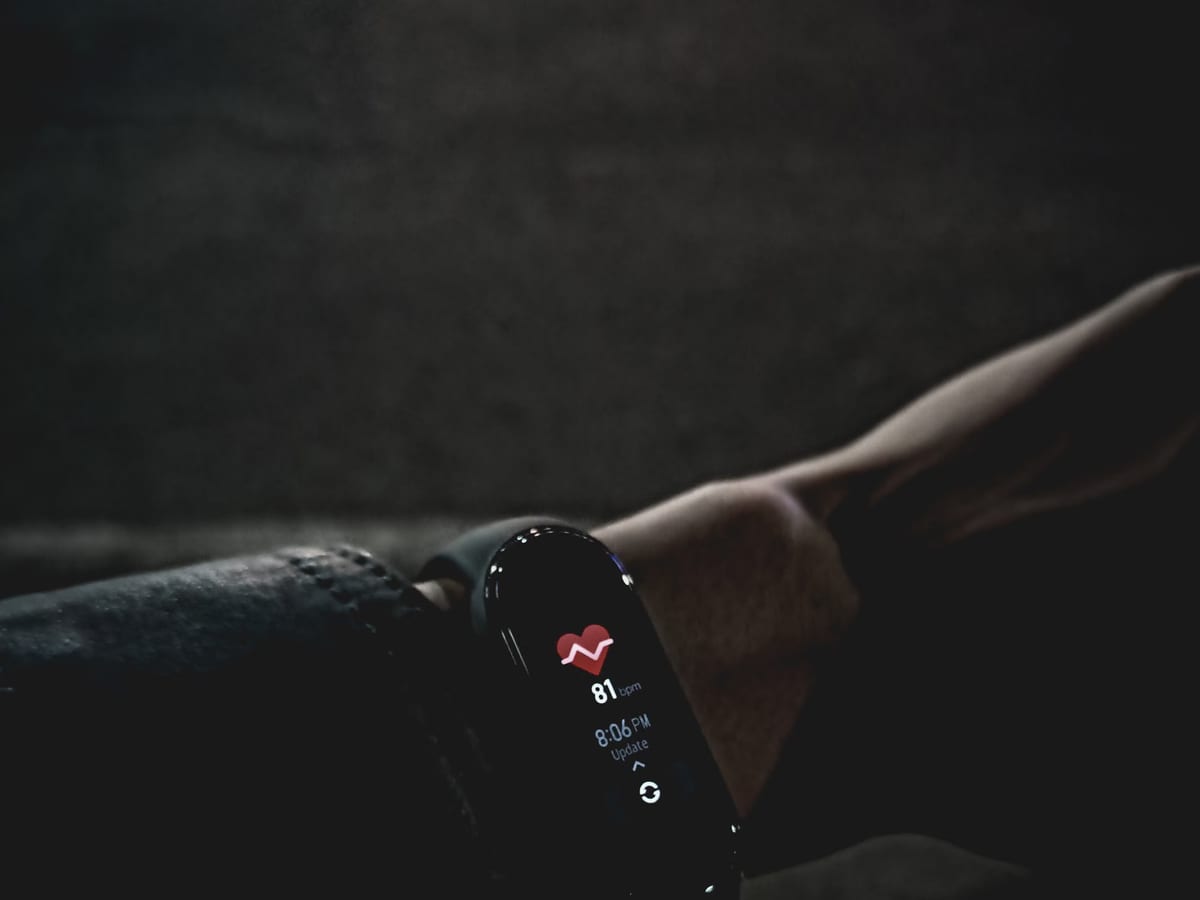
Wearable Telemetry Units
Body-worn sensor pods with 1000 Hz inertial capture, dual-band GNSS and an indoor local positioning fallback.
Module detail — Wearable Telemetry UnitsModule 02 · Load & Readiness
External load, internal load and readiness held on a single per-athlete timeline — with the measurement error shown rather than rounded away.
External load is everything the athlete did, measured from outside the body. From the positional stream we derive total distance, distance within configurable speed bands, peak velocity, and the count and magnitude of accelerations and decelerations above your thresholds. From the inertial stream we derive a mechanical work proxy built from the resultant acceleration vector, plus impact and jump counts where the movement signature supports them.
The important word there is configurable. Speed-band thresholds are not a physical constant; they are a coaching decision, and they differ between a rugby forward and a football winger, between senior and academy squads, and between clubs with different playing models. Vendors who hard-code their bands make cross-club comparison look easy and make it wrong. We ship sensible defaults, expose every threshold, and record the threshold set alongside every metric so that a number computed under last season's definitions is never quietly compared to this season's.
External load tells you what was done. Internal load tells you what it cost. We combine two sources: heart-rate-derived load using Banister's TRIMP or Edwards' summated zone score depending on your preference, and session-RPE, the rating-of-perceived-exertion score multiplied by session duration. Session-RPE is captured on the athlete companion app inside a configurable window after the session, because the validity of the measure degrades when it is collected hours later or in front of a coach.
Neither source is sufficient alone. Heart-rate load systematically under-weights resistance training and high-intensity intermittent work; session-RPE is subjective and drifts with mood, fixture proximity and squad culture. Holding both on one axis, and showing when they disagree, is more useful than fusing them into a composite that hides the disagreement.
The readiness model is built on the root mean square of successive differences between RR intervals — RMSSD — captured from a short standing or supine measurement, log-transformed and expressed as a rolling seven-day mean against the athlete's own baseline. The log transform is not cosmetic: raw RMSSD is strongly right-skewed, and comparing raw values against a mean produces misleading day-to-day noise.
We also show the coefficient of variation of that rolling window, because a stable low value and an unstable high value mean very different things. And we show the measurement conditions — time of day, posture, whether the athlete had already eaten or trained — because RMSSD is sensitive to all of them and a protocol violation explains more anomalies than any physiological change.
The workspace computes rolling load windows from three to forty-two days, exponentially weighted as well as simple, and it will compute an acute:chronic workload ratio if you ask for one. It does not put ACWR on the default dashboard, and that is a considered decision. The ratio has well-documented statistical problems — mathematical coupling between numerator and denominator, sensitivity to the choice of window, and spurious correlation artefacts that have been demonstrated repeatedly in the literature since the late 2010s.
None of that makes it useless. It makes it a metric that requires context, which is why we treat it as an optional view with the coupling explained inline rather than a headline number. We wrote at length about this in The Acute:Chronic Workload Ratio and Its Limits.
The most valuable part of the module for most clients is not retrospective. It is the planned-versus-actual view: you enter next week's sessions with expected durations and intensities, the model projects what that does to each athlete's rolling exposure, and you see the athletes for whom the plan is a step change before you run it. Adjusting a Tuesday session on Monday is worth more than a very precise report about it on Friday.
This module does not predict injury, does not produce a single readiness traffic light, and does not tell a coach who should train. It produces measurements, ranges and comparisons against an athlete's own history. The interpretation is a job for people who know the athlete.
Everything here exports. Session summaries and daily aggregates go to CSV or JSON on a schedule, or straight into your athlete management system over the REST integration. Raw RR interval series export too, for departments running their own HRV analysis. If you want to reproduce our readiness figure in your own spreadsheet, the calculation is documented and the inputs are available.
Elsewhere on the chain
Body-worn sensor pods with 1000 Hz inertial capture, dual-band GNSS and an indoor local positioning fallback.
Module detail — Wearable Telemetry Units
Multi-camera pose estimation for joint kinematics without suits, markers or a laboratory booking.
Module detail — Markerless Motion Capture
Survival models over exposure history that surface changing risk profiles instead of a single traffic light.
Module detail — Injury Risk ModellingForty-five minutes, one anonymised session file, and a straight answer about whether this module solves the problem you actually have.